Proof Test Coverage Calculations
Proof test coverage calculations
Finally, it is time to talk about proof test coverage calcs! Recall that when we covered how to model proof testing, we took the proof test coverage as an assumption, but no longer (kind of).
Unfortunately it is still pretty difficult to get rid of assumptions, and there is a heavy reliance on vendor data, as we will see.
Single Components Permalink
Vendor & Generic Data Permalink
Figuring out the proof test coverage for a single component (an actuator, a valve, a level switch, etc.) is actually pretty easy, you just look it up. Let’s start with a valve, perhaps a Jamesbury 9000 series ball valve. Typically, to evaluate the proof test coverage of a device, you’d like to have the safety manual and the safety certification for that product. Most likely you will need to ask the vendor for the latest copy of these materials, however, older copies are usually available online, so I am using that for this example.
The safety certification we are using for the Jamesbury 9000 gives us the following info:
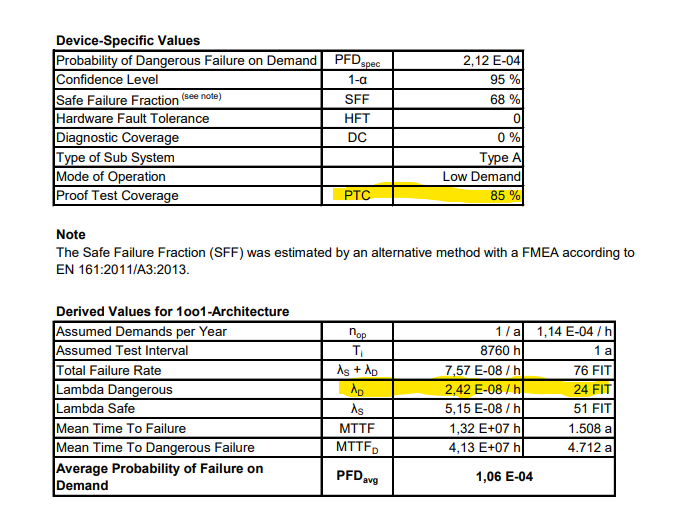
From this we can read off our lambda (24 FITs), and our proof test coverage (85%). If 24 FITs seems a bit low to you (for comparison, the generic data low end for a ball valve is around 300 FITs, for valves that close on trip—see SILSafeData), then you might want to consider substituting generic data in. Note that SILSafeData won’t give you the proof test coverage for generic equipment, I think you need to buy their books for that. It would be nice if anything in the SIS world was free (except this blog of course, no charge there).
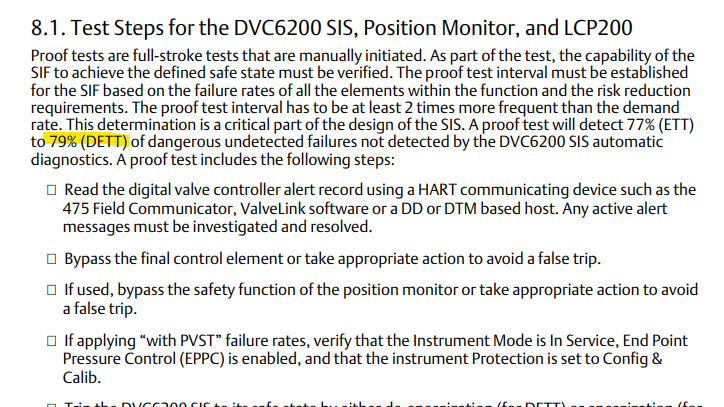
The safety manual for the valve tells us what we actually have to do as part of our proof test (to achieve the 85% coverage).
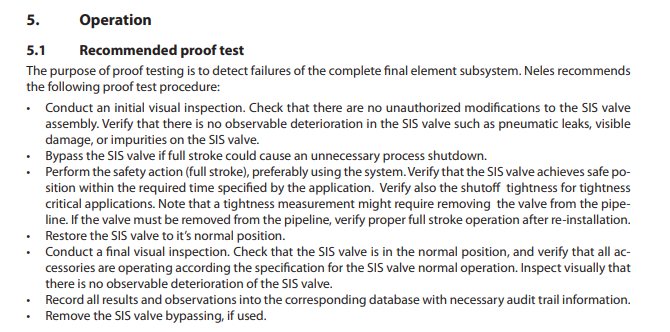
Basically we have to stroke test the valve, and give it a visual inspection.
Data Sources Permalink
As is likely obvious from above, reliable data is the hardest part of determining the proof test coverage (and failure rate!) for a single component. You can trust the vendor certifications, you can pay for the generic data sets, or, if you are lucky, your organization may keep it’s own, internal data.
Multiple Components Permalink
Let’s stick with the vendor data in this example. The next step is to figure out how proof test coverage for multiple devices combine. After all, when we go out and stroke our valve, we aren’t just testing the valve, but also it’s actuator, positioner, solenoids, etc. We need a way to understand how a proof test (stroking a valve) effects an entire system of components.
I find that a concrete example is often useful, so assume our safety function shuts off fuel gas to a furnace. This is a fairly standard safety function out in industry. Our system consists of a Jamesbury 9000 series ball valve, Neles B1J actuator, and Emerson DVC 6200. Note that I am ignoring the sensors and logic solver, because they are not components that are involved in the proof test of the valve.
Actuator Permalink
We already covered the ball valve above; the actuator safety manual and certificate combine to furnish the following information (again, always obtain current documentation from your vendor, and then question it):
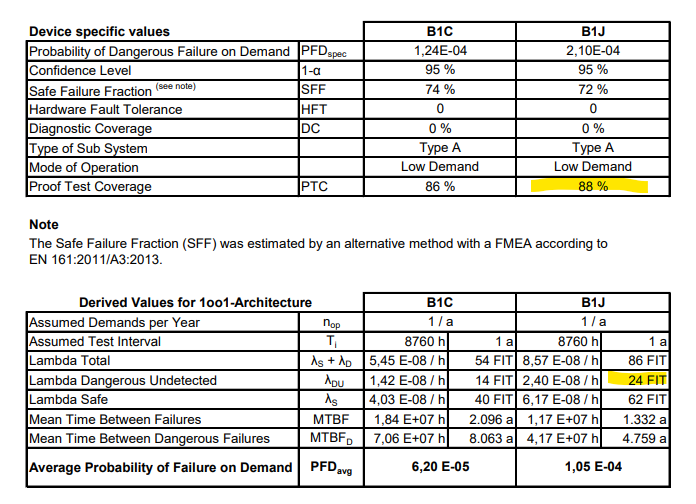
Again, it’s worth noting that generic data puts the low bound on a pneumatic piston actuator failure rate at 120 FITs.
Digital Valve Positioner Permalink
The final element we will need is our DVC, which serves as the interface between the electrical and pneumatic signals. Safety manual and certification yield the following:
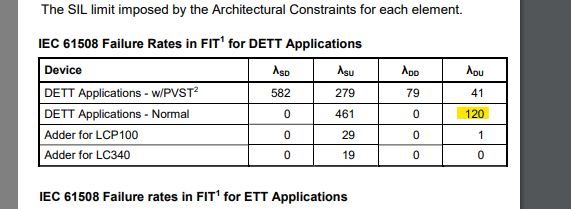
Where DETT stands for de-energize to trip, which is a pretty common setup.
Calculating Coverage Permalink
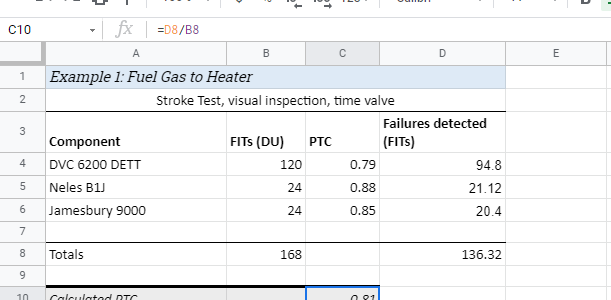
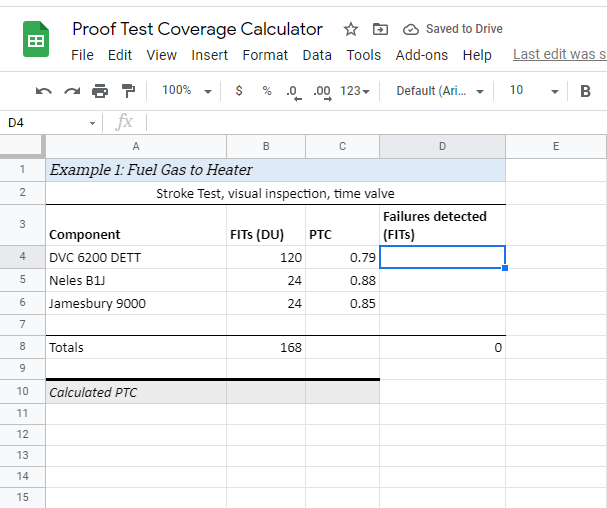
Time for a new spreadsheet! Let’s start by getting all of our information put in; set up a sheet like so:
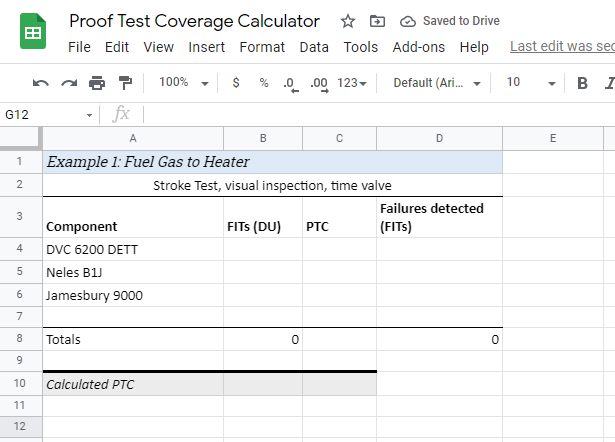
Now enter the FITs and proof test coverages from above:
Compute the failures detected by multiplying the failure rate (FITs) by the proof test coverage:
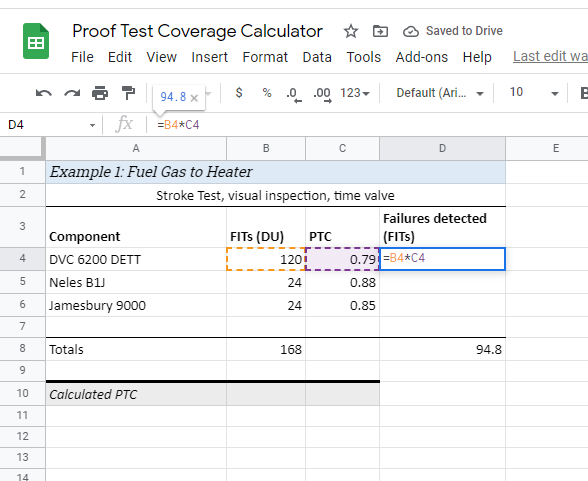
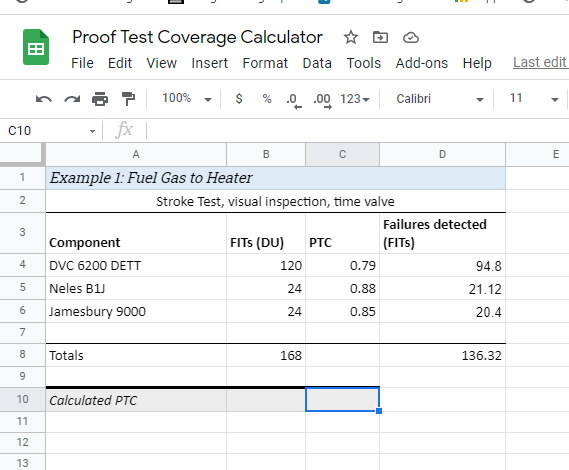
Filling that down we get:
Calculation of proof test coverage is done by dividing the failures detected (technically failure rate since we are in FITs = failures per billion hours) by the total failure rate:
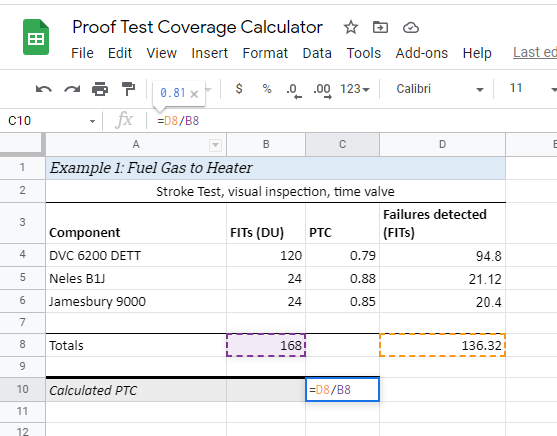
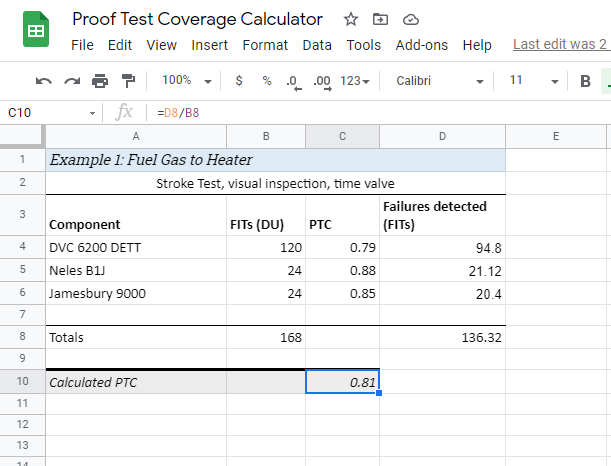
Notice that this isn’t a straight average of the proof test coverages of the individual components, it’s weighed by the number of failures. Components with high failure rates contribute more to the calculated proof test coverage than those with lower failure rates.
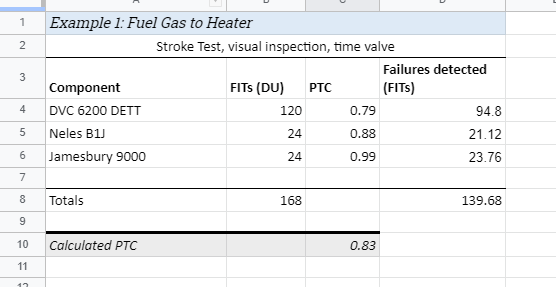
So, for the sake of argument, if I were to adjust the coverage on our ball valve to 99%, it doesn’t make that much difference to our overall PTC:
But, if I change the DVC to 99%, that makes a big difference:
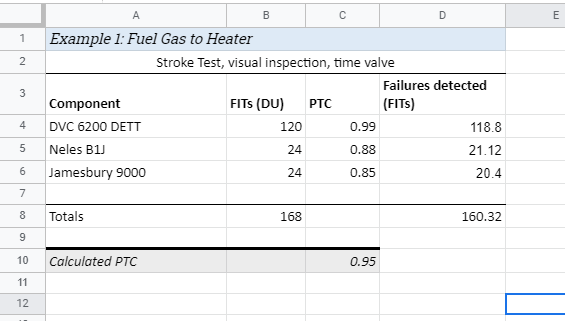
The takeaway here isn’t that DVCs are more important to PTC than valves, its that whatever has the highest failure rate, makes the biggest difference.
Improving Coverages Permalink
What if your proof test goes above and beyond what the vendor says is required (to achieve their stated proof test coverage). Well, we are getting into the arena of engineering judgement here, so what follows is a mostly qualitative description, but hopefully it is still helpful.
Case 1: You Buy New Permalink
On one extreme, you could just throw the whole installation out and install all new components at every proof test interval. Costly, but you are pretty much guaranteeing you can claim 100% proof test coverage; everything is new, so logically you would start tracking failure rate from zero again.
Case 2: You Overhaul Everything Permalink
You pull the valve (or the sensor, or whatever) and all it’s accessories and send them to the shop for a complete overhaul. All gaskets, O-rings, and other soft goods get replaced, surfaces get machined and smoothed, the valve is stroke tested in the shop, timed, leak tested, linkages are cleaned up and repaired if required, etc.
Now what proof test coverage do we claim?
This is a judgement call, but typically something high, like 95-100%. You should review the performance of your device after it’s overhauled, dig into the components of the device that are repaired and those that are not, and make a decision.
Case 3: Mixed Overhaul, Replacement & Inline Tests Permalink
Fairly straightforward here, if you replace it then you treat it as 100% proof test coverage, overhauled components treated as per case 2, inline tests treated as in our main example above. Plug the respective coverages into the sheet and compute the total coverage for the assembly.
Case 4: Something In-between Permalink
You’re not pulling and shopping the valve (or device, valves are just an easy example), but you’re still doing more than the vendor requires. Maybe you run a valve signature, leak test the valve inline, or perform some other type of inline repair or diagnostic.
Now what’s the coverage? This one is completely up to you, there are too many variables. How has the device performed in the past after similar inline repairs? Can you argue that the additional testing you are doing makes a measurable difference in the valve’s failure rate? Are you relying on the improved proof test coverage to pass your SIL calcs, or is it just gravy? (If it is, then maybe do the extra testing, but don’t take the credit for it)
That’s all I’ve got for now, next time we will talk partial stroke testing coverage.